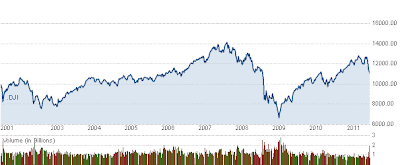
Stock Market Terms W Formation
W formation A technical analysis term used to describe a chart on which the price of a security has made two approximately equal bottoms over a period of time. Technical analysts try to buy at one of the bottoms in anticipation of a rise (which would make the shape of a "W" on the chart). also called double bottom. opposite of double top.
